Data tokens on this page


Bottom Quintile ESG Companies: A Risky Proportion
Bottom Quintile ESG Companies: A Risky Proportion
Following the October 2010 environmental disaster in the Gulf of Mexico, most of the socially responsible investment crowd fell into one of two camps: those who had held BP in their investment portfolio, and those who claimed their ESG analysis led them to avoid the stock.1
Statistically speaking, we believe it prudent to acknowledge the limits of ESG ratings with respect to predicting individual disasters, while acknowledging the importance of these ratings at the aggregate portfolio level. We know that, due to the Law of Large Numbers, as the number of outcomes increases, the average value settles closer to the expected outcome. Having avoided BP due to ESG concerns may be heralded a triumph, while not necessarily being indicative of the effectiveness of ESG ratings.
Rather than extrapolate from the BP experience, we instead look to the aggregate evidence to find compelling reasons to incorporate positive ESG scoring in the investment process.
Environmental, Social and Governance Ratings
We used ASSET4’s Environmental, Social and Governance ratings, which incorporate a wide array of extra financial data:
- Environmental: Resource Reduction, Emission Reduction, Product Innovation
- Social: Work Force & Employment Quality, WorkForce Health and Safety, Workforce Training and Development, WorkForce Diversity and Opportunity, Society/Human Rights, Community, and Customer/Product Responsibility
- Governance: Board Function, Board Diversity, Compensation Policy, Vision and Strategy, and Shareholder Rights.
Modifying Environmental, Social and Governance Data
We have observed ESG Data carries significant sector biases. For example, Technology, Consumer Staples, and Industrial sectors are over-represented among highly rated companies (relative to their proportion of the total investment universe), whereas Financials and Services are significantly under-represented.
Additionally, the ESG data carries significant biases with respect to common risk factor exposure. Highly-rated companies by ESG score tend to have lower beta and far less earnings variability. By contrast, poorly rated companies have lower dividend yield and a higher P/E ratio on average.
Our research has shown controlling ESG scores for sector biases is an effective means of correcting for much of the aforementioned biases. We in turn analyzed the risk attributes of these sector-normalized ESG scores.
Why Environmental, Social and Governance Data is an Effective Risk Indicator
Companies with poor ESG practices may be prone to higher litigation costs, and are increasingly being forced to answer to activist shareholders. Risks to each respective area include:
- Companies with poor Environmental practices may face significant fines for environmental impact, or significantly higher future CapEx expenses if they are caught off-guard by increasingly stringent environmental regulations.
- Companies with poor social practices, such as questionable human rights practices (either in their direct business or in their supply chain) may suffer impaired demand and client loyalty via product boycotts.
- Companies with poor governance practices, such as a lack of Board Diversity, may be more likely to suffer mismanagement or fraud.
Again, we believe it is diffcult to predict with any precision when any of the above might impact any one given company, but each of these represents a real potential risk to business as usual for a going concern.
Environmental, Social and Governance Ratings and Stock Volatility
We examined an equal-weighted blend of environmental, social and governance scores for all S&P 500 Index constituents as well as the 500 largest stocks in the Russell 1000 Index. After sorting the universe by sector-normalized ESG score, we broke the universe into quintiles and examined the volatility characteristics of each group, focusing on the volatility of the highest- and lowest-rated quintiles.
We found the stocks of companies which have poor environmental, social and governance policies exhibit significantly higher total volatility than the stocks of companies with the best environmental, social and governance ratings. We found this to be true not only when measuring the average total volatility of the respective groups, but also when measuring the average stock-specific volatility, purified for common factor risk effects:
Poor ESG Scores Reflect Higher Volatility
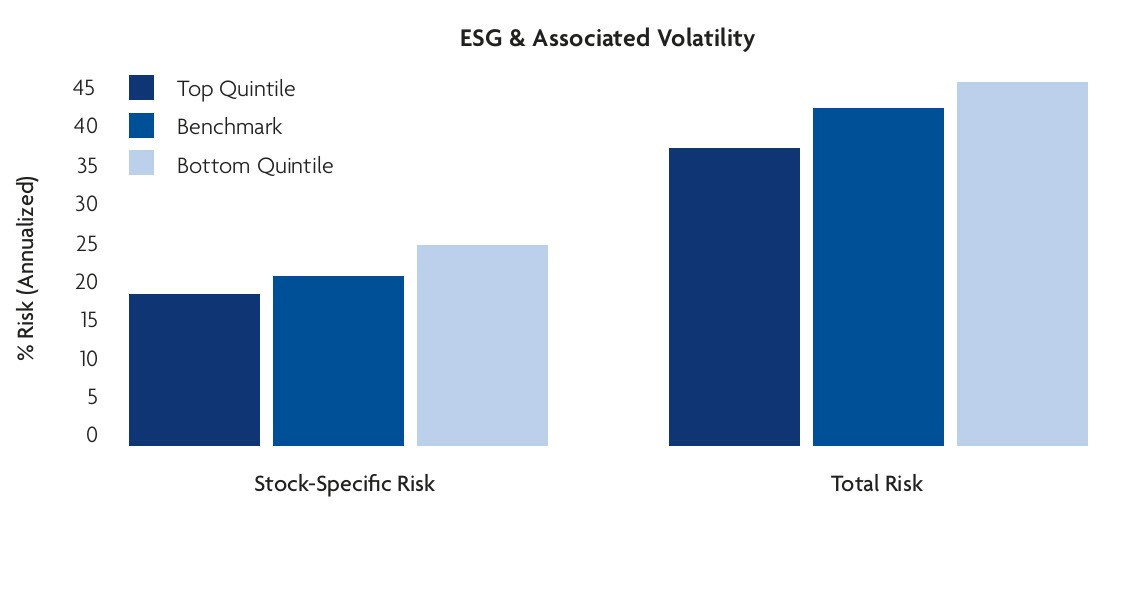
Source: Disciplined Equity Team Research, ASSET4, MSCI Barra
Modern Portfolio Theory and Volatility
Modern Portfolio Theory (MPT) uses the terms “risk” and volatility interchangeably. Most investors, however, experience risk as the possibility of significant capital loss. In other words, volatility can be higher entirely because of a few large positive observations, but that’s “risk” we’d all welcome!
While the results above show stocks of companies with poor ESG policies and practices do indeed exhibit higher volatility, we believe it’s essential to understand the structure and composition of the return distribution. If the distribution of observed returns for stocks of companies with poor ESG policies has a higher incidence of extreme negative outcomes, these stocks should indeed be considered more risky, whether viewed from the ivory tower of the MPT theorist, or from the portfolio statement of the individual investor, family offce, endowment/foundation, or plan sponsor.
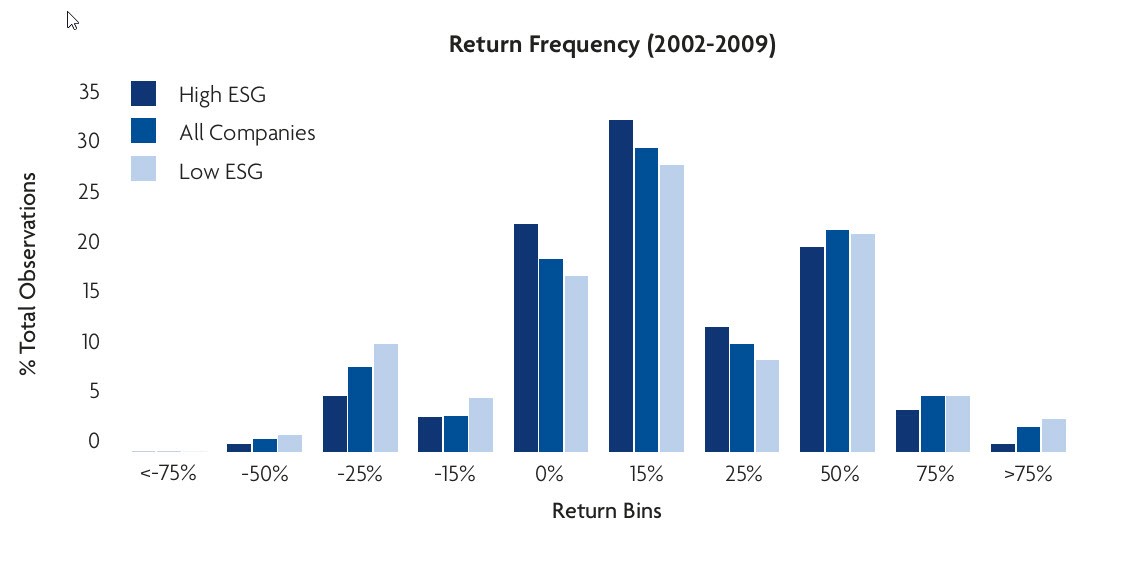
We sorted all companies in our large-cap investment universe by their sector-normalized ESG score on a yearly basis. Scores were updated each August 31st, which is the typical date by which companies have released all extra-financial data for the previous calendar year. We calculated each company’s one year forward relative return (relative to that year’s median return), and binned the individual forward one year relative returns. This allowed us to observe the frequency of extreme negative outcomes for the top-rated and lowest rated companies, respectively.
The results of over 4,000 observations are highlighted below. Stocks of companies with poor ESG policies have a far higher propensity for extremely negative outcomes. In fact, stocks of low-rated companies are nearly twice as likely to have a relative return of -25% or worse when compared with highly-rated companies (interestingly, then entire population falls directly in between these two extremes).
Stocks With Poor ESG Have Higher Propensity For Negative Outcomes
Conclusion
There is no “silver bullet” when predicting the likelihood of a single company’s chance of having an environmental disaster, fraudulent accounting practice, or human rights abuse. However, by incorporating a broad swath of extra-financial data as a risk factor, and tilting the managed portfolio away from companies with poor ESG policies, we can better control a portfolio’s exposure to stocks with a higher propensity of extremely negative outcomes.
1. U.S. large cap investment universe (S&P 500 Index members and top 500 members of the Russell 1000 Index) did not include BP.
Disclosure:
This information has been prepared for informational purposes only and Great Lakes Advisors, LLC (GLA) is not soliciting any action based upon it. The material is not intended to provide specific advice or recommendations but, rather, a basis from which strategies can be built, taking into account the specific objectives of each portfolio, in terms of return, time horizon, and risk constraints, as well as diverging investment perspectives and assumptions. The material contains information regarding the investment approach described herein and is not a complete description of the investment objectives, policies, guidelines or portfolio management and research that supports this investment approach. Any decision to engage Great Lakes Advisors should be based upon a review of the terms of the investment management agreement and the specific investment objectives, policies and guidelines that apply under the terms of such agreement.
Opinions expressed are the Disciplined Equity Team’s present opinions only and are subject to changes based on market, economic and other conditions and may not actually come to pass. Any historical price(s) or value(s) are also only as of the date indicated. Past performance is no indication of future returns.
Frank Russell Company (FRC) is the source and owner of the Russell Index data contained or reflected in this material and all trademarks and copyrights related thereto. The presentation may contain confidential information and unauthorized use, disclosure, copying, dissemination, or redistribution is strictly prohibited. This is a Great Lakes Advisors’ presentation of the Russell Index data. Frank Russell Company is not responsible for the formatting or configuration of this material or for any inaccuracy in Great Lakes Advisors’ presentation thereof.
Standard and Poors, a division of the McGraw-Hill Companies, Inc., is the owner of the trademarks and copyrights relating to the S&P Index. The products is not sponsored, endorsed, sold or promoted by Standard and Poor’s. Standard and Poors makes no representation regarding the advisability of investing in this Product.
©2013 Great Lakes Advisors
