Data tokens on this page

2022: A New Dawn for Value Stocks?

Contributing Authors: Ray Wicklander III, CFA®, CPA, Wells Frice, CFA®, Scott Macke, CFA®

2022: A New Dawn for Value Stocks?

Contributing Authors: Ray Wicklander III, CFA®, CPA, Wells Frice, CFA®, Scott Macke, CFA®


As we enter 2022, we remain confident that the conditions are right for a significant turn in the Value-Growth cycle. 2021 was mixed, with a few false dawns for Value, but Value ended the year (again) lower, compared to Growth, and at about the same level as the trough in Fall 2020. This marked the fifth consecutive year of Value underperformance, during which time, relative to growth, Value has lost about half of its value (i.e., a 50% cumulative relative decline, using the Russell 1000 Value and Growth indices).

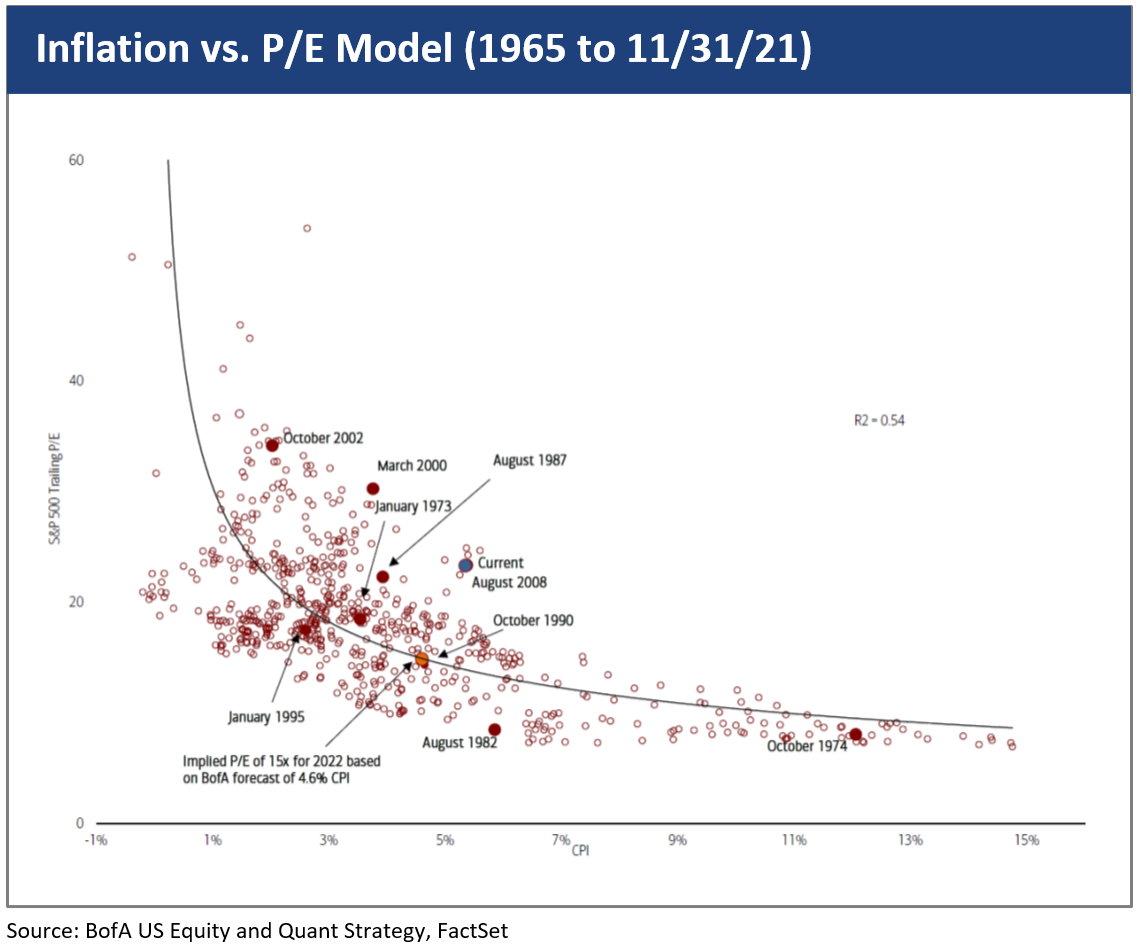
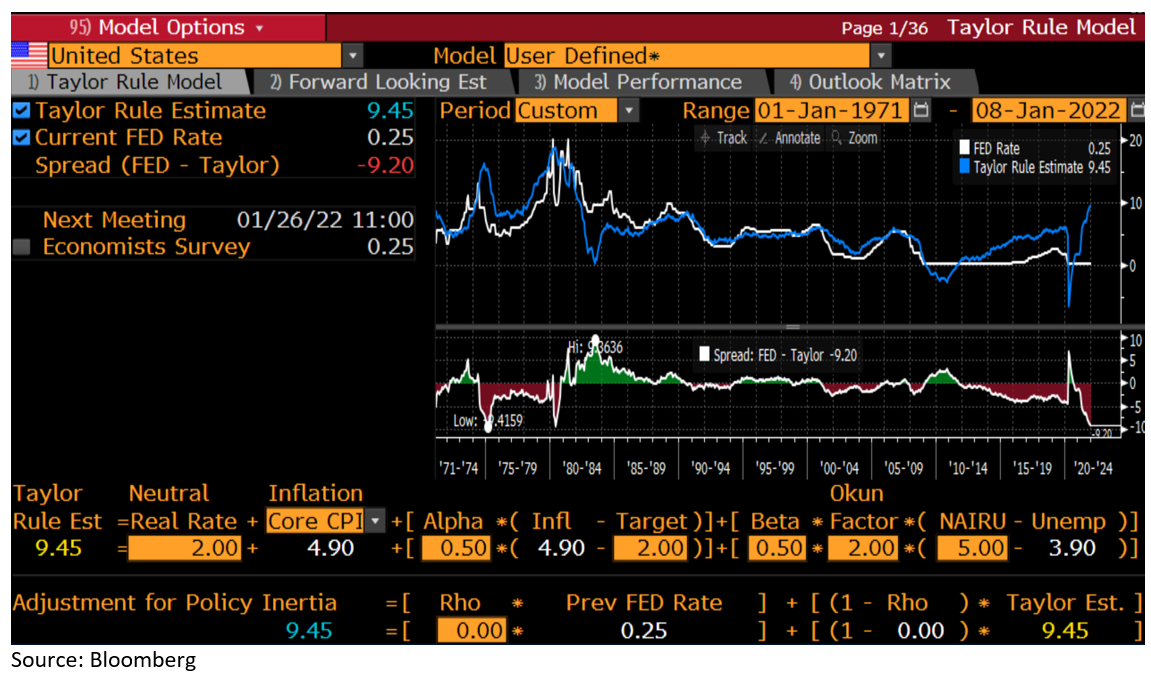
We believe the conditions are right for a few reasons, namely, higher inflation, higher real interest rates (i.e., less-negative real interest rates), and what we feel are clear signs of excessiveness in Growth/Momentum sectors’ valuations. The relative payoff to Value, we think, can be very significant, given valuation differentials between Value and Growth are at essentially the same levels as the Internet Bubble of 1999-2000. That combination (better-than-average probability and higher-than-average payoff) is compelling, and the definition of an attractive risk-reward.

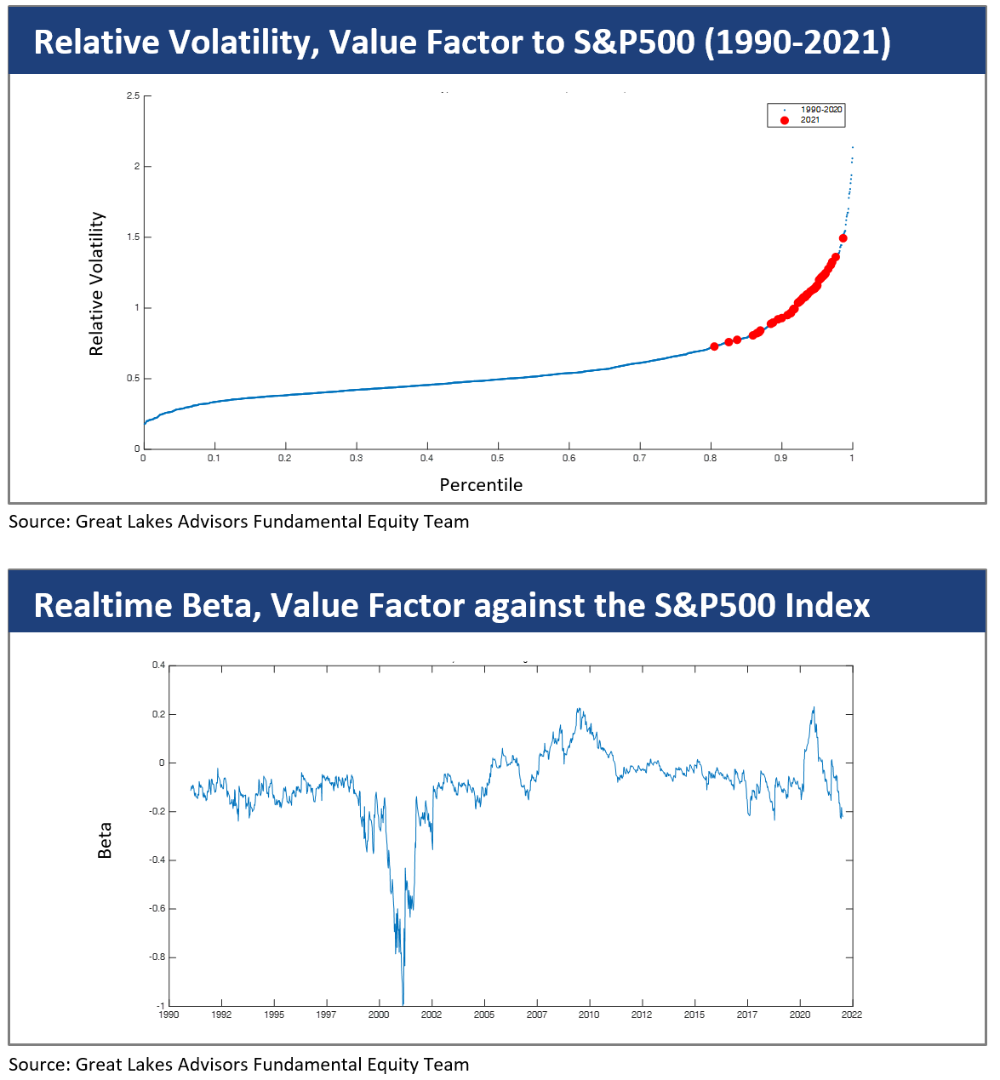
Volatility has been very high, and that’s not uncommon around inflection points. The top chart below shows the relative volatility of Value to the overall market, and the latter is the “realtime” beta of Value to the market. Each shows 2021 as anomalous, rhyming in many respects to 1999-2000. The relative volatility of Value in 2021 was more than double the long- term average, and eclipsed only by a few weeks in 2000. Value’s beta has compressed to sharply negative, a welcome development in our view, and rightly reflecting a much lower risk profile for Value stocks, when compared to a very expensive and vulnerable broader market. And the most negative since…1999-2000.

Relative Volatility, Value Factor S&P500(1990-2021)


A more comprehensive look at inflation and interest rates – why we feel both are skewed higher, and what that means for stocks – can be seen at both a bottom-up level and throughout the broader market. From the broad market perspective, the below chart shows the discount rates (which are market-implied) for expensive (orange) and cheap stocks (grey), with the difference in blue. Not only are discount rates for the expensive cohort hovering near all-time lows, the spread between the two is at an all-time high, equal to the Internet Bubble, and far above “normal”.

Comprehesive look at inflation


Inflation is the foundation for all financial assets’ valuation. Inflation is ground zero, then an assumption of real interest rate, then equity risk premiums, style premiums, region premiums, etc., to arrive at nominal return expectations. Inflation, by any definition (CPI, Core CPI, PCE, Core PCE), reached multi-decade highs in 2021. There are many theories given for inflation’s increase, the most popular being generalized “supply-chain problems”, but the simplest explanation, “money printing”, is the most rational and least nebulous to us. 

Money supply, shown below as M2, year over year, rose by the most ever in the aftermath of COVID. For reference, the inflationary 70’s saw a max M2 year-over-year in the mid-teens; 2021 saw 27%. The last observation (Nov 2021) was 13%, i.e. 13% higher than November 2020, which itself was 24% year-over-year. The lagged and cumulative effect of this extraordinary monetary stimulus is very significant in our view.

Inflation Chart


It is also undeniable that monetary profligacy has benefitted asset prices. It is fairly straightforward to understand this on a very micro level. For example, when mortgage interest rates are less than inflation, you are being paid to purchase a home. Equally, when it becomes collective knowledge that cash is being devalued, the rational thing to do is to buy real assets, like stocks, art, real estate, precious metals, or cryptocurrencies. Emerging markets have dealt with this for decades, and, EM returns are always measured in “hard” currencies as a result (because local currencies reliably devalue).

U.S. equity returns need to be seen through the lens of dollar depreciation. The S&P 500, from 12/31/2019 to 11/30/2021, was up 45% (total return). However, M2, over the same period, was up 40%, making the equity market look a little less impressive (less than 3% “real”, annualized, not exactly a raging bull market).

There are important technical reasons why inflation is, in our opinion, likely to remain higher for longer. The single largest component of CPI is something called “Owner Equivalent Rent (OER)”, at 23.5%. This compares to all of Health Care at 7%, Energy (i.e. gasoline and utilities) at 7.4%, and Food at 14%. OER is designed to quantify the impact of rent and home price appreciation. Its most recent observation (3.6%, see below), falls woefully short of common sense about what the U.S. Real Estate market is doing.

Consumer Price Index for All Urban Consumers


Zillow reports a home price change – nationwide – of over 19% in 2021, while CoreLogic reports rental growth of over 10%. These numbers are much more in line with what we’re all seeing in our neighborhoods, and much more credible than the BLS’s 3.6%. A more realistic 10% on OER would add fully 1.7% to CPI, and push current CPI to closer to 9%. The lagged impact of asset price inflation will almost certainly keep CPI well supported in the near future, and pressure on the Federal Reserve to do more about it.

The implications for the markets are not good. If inflation is a lagged outcome of money printing, then P/E multiples are usually a lagged victim of inflation. We see this both in the U.S. (we show a chart below from Merrill Lynch, plotting inflation against U.S. P/Es), and cross-sectionally by country (e.g. high-quality, well-capitalized Turkish companies trade for mid-single digit P/Es).

Inflation vs. P/E Model (1965 to 11/31/21)


Finally, the direction of real interest rates is very important for nearly every asset class, and skewed upward in our opinion. Believe this or not, but the Taylor rule suggests the Fed Funds rate should be currently higher than 9%, and that monetary policy today is the loosest since the mid-70s. Most say the Taylor rule is obsolete, but it gives simple, objective (and currently, very uncomfortable) output. Among the critiques are that the real neutral rate should be 0% or less because of a global savings glut, the unemployment rate currently overstates the strength of the labor market, because of underemployment, and the currently-high CPI is only “transitory”. 

Direction of interest rates


But the point stands that, even if real interest rates rise, stopping short of actually turning positive, that should, in turn, affect real equity risk premiums, term premiums in fixed income, and so forth. And when discounts rates are this low, for a large percentage of the equity market a small move upward in rates can result in significant downside risk. We will continue to be appropriately cautious in an exuberant market.

Download Article

Great Lakes Advisors, LLC (“Great Lakes” or “GLA”) is an investment advisor registered with the Securities and Exchange Commission under the Investment Advisors Act of 1940. Established in 1981, Great Lakes is a subsidiary of Wintrust Financial Corporation and a part of the Wintrust Wealth Management family of companies. On October 1, 2013, majority owned subsidiary Advanced Investment Partners, LLC (“AIP”) became fully-owned and integrated into Great Lakes. Great Lakes is a distinct business unit with distinct investment processes and procedures relating to the management and/or trading of investment portfolios for its clients.

Great Lakes Advisors, LLC claims compliance with the Global Investment Performance Standards (GIPS® ). A complete list of firm composites and performance results, and the policies for valuing portfolios, calcu­lating performance, and preparing GIPS compliant presentations are available upon request. Great Lakes Advisors, LLC’s fees are available upon request and may be found in our Form ADV Part 2A. Performance data quoted herein represents past performance. Past performance does not guarantee or indicate future results. Returns and net asset value will fluctuate.

Manager commentary represents an assessment of the market environment at a specific point in time and is not intended to be a forecast of future events, or a guarantee of future results. This information should not be relied upon by the reader as research or investment advice. To determine if this strategy is appropriate for you, carefully consider the investment objectives, risk factors, and expenses before invest­ing. The holdings, industry sectors, and asset allocation are presented to illustrate examples of the securities bought and the diversity of areas in which we may invest, and may not be representative of current or future investments. Portfolio holdings subject to change and should not be considered investment advice. The specific securities identified and described do not represent all of the securities purchased, sold or recommended for advisory clients and it should not be assumed that investments in the securities identified and discussed were or will be profitable. To obtain a list of all securities recommended during the past year, contact Great Lakes Advisors (GLA) at 312.553.3700. Actual clients’ portfolios may or may not hold the same securities depending on the guidelines, restrictions and other factors of the specific portfolios.

Share